
After more than a decade of rising markets, 2022 ushered in a period of sustained market volatility, including sharp falls across equity and bond markets.
It's often during times of heightened volatility that many active managers claim that this is the kind of environment during which they have a particular advantage over index strategies, given the former's mandate to pick the winners while the broader market declines. Can it be all so simple?
As outlined in our 2023 update of The case for low-cost index-fund investing, low-cost index funds and ETFs tend to outperform higher cost active strategies over the long term - but what about during periods of sustained market volatility?
Zero-sum game theory held true in 2022
The case for low-cost indexing is based on the zero-sum game theory, which dictates that for every winning position, there should be an equal-sized losing position. This means there should be an equal amount of outperformance and underperformance over any given period in any given market.
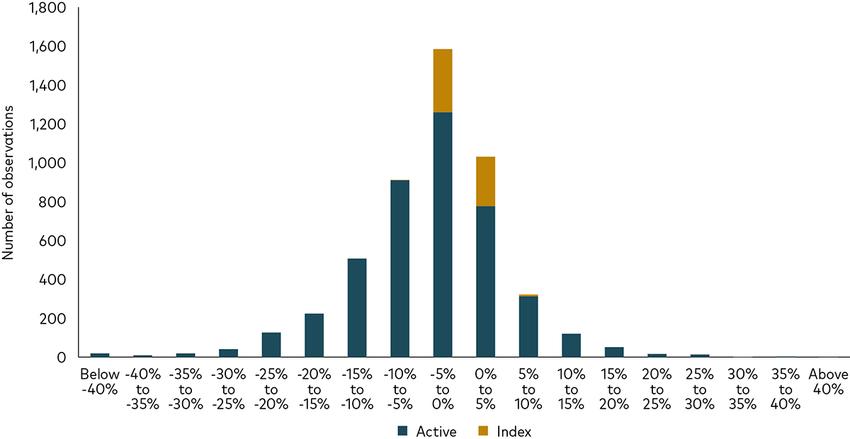
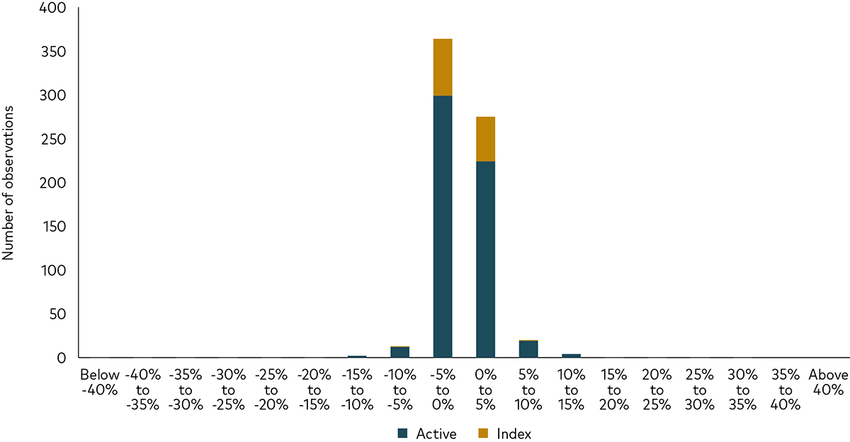
To examine the case for active management in volatile markets, we isolated 2022 returns to see if there was any divergence from the longer-term trend. The chart below shows the distribution of excess returns achieved by UK active and index managers in 2022 after costs. The height of the bar reflects the number of funds with that level of performance. As we go from left to right, fund performance improves.
Excess returns for UK active and index funds in 2022
Equity Funds
Fixed Income Funds
Past performance in not a reliable guide to future returns.
Sources: Vanguard calculations, using data from Morningstar, Inc. Note: The charts display the distribution of excess returns of active and index equity and fixed income funds available for sale in the UK relative to their primary prospectus benchmark for the 1-year period ending 31 December 2022.
More than half of active managers—spanning equity and fixed income strategies—failed to beat their benchmark in 2022. Index funds, as expected, are centred around the benchmark return (the point of 0% excess return) although generally sit to the left of the curve, slightly less than the benchmark return.
So, we know that last year was not a particularly great year for active managers in the aggregate. What about other periods of market turbulence?
Vanguard low-cost active funds
Our heritage in active fund management dates back to the year we were founded - 1975.
Volatility is most closely tied to a wider range of return outcomes
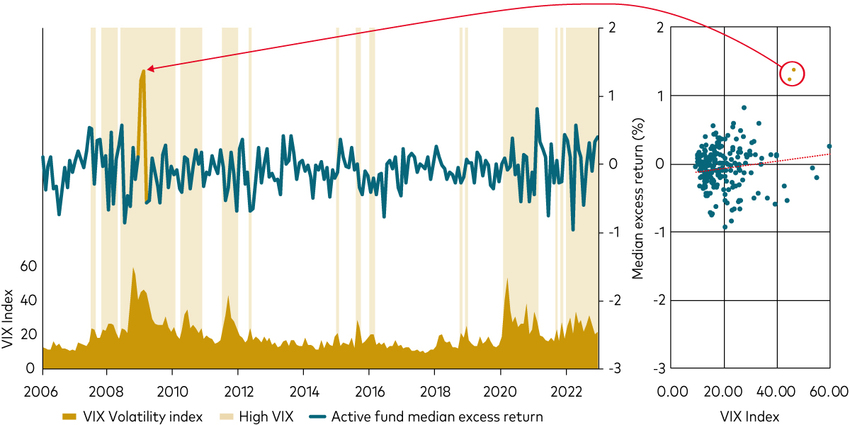
We looked further back to see if there is any indication that volatility benefits active managers on the whole and found no evidence outside of two months in early 2009 when the average US active equity fund—a far larger universe relative to the UK—outperformed the benchmark, as illustrated in the chart below.
The green line shows the median excess return for US active equity funds between 2006 and the end of 2022. The light, yellow-shaded areas represent periods of heightened market volatility, as indicated by the VIX volatility index, which measures investors' expectations about how volatile markets will be over the next month. The higher the number, the more volatile markets are expected to be, so in theory a high VIX number is a signal for active managers to exploit opportunities that index funds simply can't.
The scatter plot on the right shows the median performance against the level of the VIX. If there was strong outperformance during volatile months, we'd expect to see the dots creep up as we move from low to high volatility. The reality is that we don't see this trend and when we draw a regression line through these points (the red dotted line), the relationship is mathematically insignificant - that is, volatility and active fund outperformance aren't related. If we remove the two months in 2009, the line is practically flat.
Active outperformed for two months in 2009
Past performance in not a reliable guide to future returns.
Sources: Vanguard calculations, using data from Morningstar, Inc and FactSet. Note: The charts display the median excess return for active US equity funds available for sale in the US relative to their primary prospectus benchmark for the period 1 January 2006 to 31 December 2022. For comparison, the VIX Volatility Index is shown over the same time period with high VIX periods (VIX > 20) highlighted in yellow.
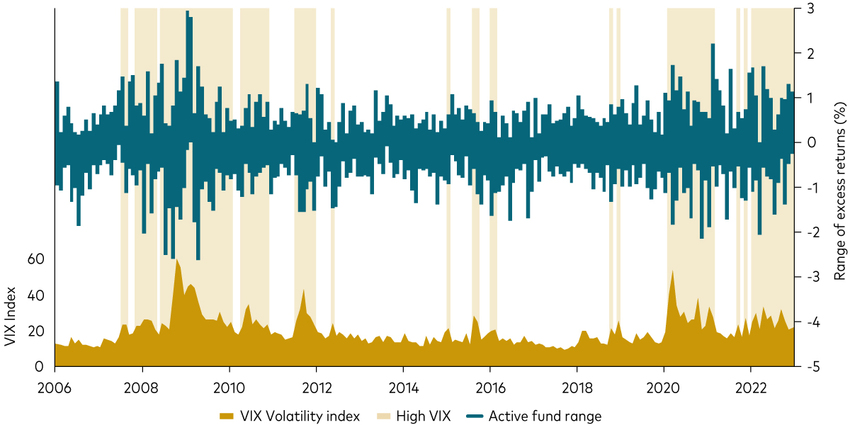
While there was no observable relationship between heightened market volatility and active fund outperformance, we did find that heightened volatility generally widens the range of outcomes you can expect from active managers.
Rather than looking at the median active fund performance during volatile markets, the next chart shows the full range of active fund performance, measuring the difference in performance between the top and bottom quartile of funds, through both volatile and more sanguine markets.
Volatility is most closely tied to dispersed outcomes
Past performance in not a reliable guide to future returns.
Sources: Vanguard calculations, using data from Morningstar, Inc and FactSet. Note: The charts display the interquartile range (25th to 75th percentile) of excess returns of active US equity funds available for sale in the US relative to their primary prospectus benchmark for the period 1 January 2006 to 31 December 2022. For comparison, the VIX Volatility Index is shown over the same time period with high VIX periods (VIX > 20) highlighted in yellow.
The data shows that heightened market volatility has tended to widen the range of outcomes for active funds. In other words, the volatility that we observe in individual stocks during turbulent markets is reflected in the volatility of active fund performance and passed along to investors.
We also looked at whether active funds tend to outperform in either the bear or bull markets that follow periods of volatility and once again the answer was no1. Over the 10 years to 31 December 2022, our analysis found that less than 20% of active equity funds available in the UK—including ‘dead'2 funds—matched or beat their prospective benchmark returns during the period3.
For investors that hold a preference for actively managed funds, the challenge is therefore consistently finding the roughly 20% of managers that can beat the benchmark over 10 years - and it's a challenge we've confronted since we were founded almost 50 years ago.
Winning the zero-sum game
As one of the world's largest active managers, at Vanguard we understand the merits of both active and index investing. For almost half a century we've strived to provide long-term alpha at a cost that represents value to investors. On an asset-weighted basis, globally our active equity funds have outperformed their stated benchmarks over the 20 years ending in December 20224, so we think we've developed a good understanding of how to do active management well.
Our approach to active investing rests on working with active managers internally and outside of Vanguard capable of delivering long-term outperformance. In our view, active managers best positioned for success are those with client-aligned ownership structures, talented teams with diverse perspectives and long-term approaches focused on deep, differentiated research and true stock and bond picking, not static factor bets.
Based on our experience, long-term outperformance is possible but it's very difficult to get right and ultimately necessitates low costs, talented portfolio managers and the patience to allow alpha to materialise. Our framework for picking active managers has enabled us to deliver long-term alpha for our investors.
The Vanguard Tough Mudder Takeover

For one day only, Vanguard will be taking over the famous Tough Mudder 5km course, to bring you, your colleagues and your peers an active day out like no other. Featuring 13 teamwork-inspired muddy obstacles jam-packed into one action-packed course, challenge yourself and your colleagues and make The Vanguard Tough Mudder Takeover your next team day out. And the best part? It's all on us.
1 Source: Vanguard calculations based on data from Morningstar. Notes: Analysis of percentage of surviving UK active funds that underperformed their prospectus benchmark across five bear markets and four bull markets spanning April 2000 to December 2022. Bull and bear markets are the local peak or trough in the global equity market, defined as the MSCI ACWI Investable Market Index.
2 Dead funds are those that were merged or liquidated during the respective period and are treated as underperforming funds.
3 Source: Vanguard calculations, using data from Morningstar, Inc. Data between 1 January 2013 to 31 December 2022. Notes: Analysis of share of active equity funds available for sale in the UK that underperformed their prospectus benchmark on a yearly rolling basis. "Dead" funds are those that were merged or liquidated during the respective period and are treated as underperforming funds.
4 Source: Vanguard and Morningstar, Inc. as at 31 December 2022. The performance of each Vanguard and non-Vanguard strategy in the Morningstar database was compared with that of its stated benchmark using monthly return data ended 31 December 2022. The monthly returns for all US-domiciled Vanguard active equity strategies, including those that were merged or liquidated during the period, were included in the performance calculations. The active equity portions of Vanguard balanced strategies were excluded. Annualised asset-weighted excess returns were generated by calculating the asset weighted cross-section monthly returns and then generating a time series set of returns. All strategy performance data are net of fees, in USD. All performance is total return and calculated NAV to NAV. Excess return is the difference between a strategy's NAV total return and the total return of its benchmark index. Results for other time periods will vary.
Investment risk information
The value of investments, and the income from them, may fall or rise and investors may get back less than they invested.
Past performance is not a reliable indicator of future results.
ETF shares can be bought or sold only through a broker. Investing in ETFs entails stockbroker commission and a bid- offer spread which should be considered fully before investing.
Funds investing in fixed interest securities carry the risk of default on repayment and erosion of the capital value of your investment and the level of income may fluctuate. Movements in interest rates are likely to affect the capital value of fixed interest securities. Corporate bonds may provide higher yields but as such may carry greater credit risk increasing the risk of default on repayment and erosion of the capital value of your investment. The level of income may fluctuate and movements in interest rates are likely to affect the capital value of bonds.
Important information
For professional investors only (as defined under the MiFID II Directive) investing for their own account (including management companies (fund of funds) and professional clients investing on behalf of their discretionary clients). In Switzerland for professional investors only. Not to be distributed to the public.
The information contained in this document is not to be regarded as an offer to buy or sell or the solicitation of any offer to buy or sell securities in any jurisdiction where such an offer or solicitation is against the law, or to anyone to whom it is unlawful to make such an offer or solicitation, or if the person making the offer or solicitation is not qualified to do so. The information in this document does not constitute legal, tax, or investment advice. You must not, therefore, rely on the content of this document when making any investment decisions.
The information contained in this document is for educational purposes only and is not a recommendation or solicitation to buy or sell investments.
Issued in EEA by Vanguard Group (Ireland) Limited which is regulated in Ireland by the Central Bank of Ireland.
Issued in Switzerland by Vanguard Investments Switzerland GmbH.
Issued by Vanguard Asset Management, Limited which is authorised and regulated in the UK by the Financial Conduct Authority.
© 2023 Vanguard Group (Ireland) Limited. All rights reserved.
© 2023 Vanguard Investments Switzerland GmbH. All rights reserved.
© 2023 Vanguard Asset Management, Limited. All rights reserved.
This post is funded by Vanguard