
Key points
We see risk where others may not. We also see opportunities. We look at things differently. With a clear aim to protect and grow your money.
Higher leverage does not necessarily translate into higher risk. In this article, we attempt to highlight how the use of dynamic risk management, coupled with efficient execution, can help mitigate the concern that risk parity strategies are vulnerable to large losses if diversification breaks down.
Dynamic Risk Models
Dynamic risk models can be used to measure and detect warning signals that can trigger exposure reduction. These include:
- Momentum overlay: exposure is reduced in assets with moderate or strong down trends;
- Volatility overlay: exposure is reduced at the asset-class and portfolio levels in response to rapidly rising volatility;
- Correlation overlay: exposure is reduced across the portfolio when there is a short-term pick-up in the risk of a bond sell-off spreading to other asset classes.
Execution
Execution is often neglected, yet it plays an important role. What use are the most accurate signals if they cannot be efficiently executed? A focus on execution naturally dictates which instruments a strategy should use to construct a portfolio. In our view, the instruments best-suited to applying dynamic risk models are predominantly futures contracts. These are generally highly liquid securities, but if overlays activate, they can significantly reduce risk over a short period of time. The resulting strategy can therefore remain cost effective if execution costs are kept low.
Dynamic risk management naturally requires more trading than the average portfolio. This requires an execution infrastructure that can reduce explicit cost (commissions, settlement costs, custodian costs, etc) and to minimise implicit costs (bid/offer spread, timing, market impact, etc). To this end, investors looking to implement such a strategy require a sophisticated execution platform that is up to the task of efficiently executing highly dynamic risk overlays. To build and maintain such a platform is a significant undertaking, requiring a great deal of investment, experience and quantitative talent to achieve results.
In summary, dynamic risk management - facilitated by an efficient execution platform - permits the use of leverage to improve risk-adjusted returns, helping a strategy perform in the good times and reduce drawdowns in periods of market stress.
Case Studies: Covid-19 and the GFC
Below, we highlight two examples of a significant sell-off in risk assets: Covid-19 and the Global Financial Crisis (GFC) of 2008. During both, the volatility of risk assets rose significantly, providing a useful illustration of how exposure and risk levels can practically be adapted to market conditions, and how such a strategy can help avoid excessive risk taking.
Covid-19 Sell-Off
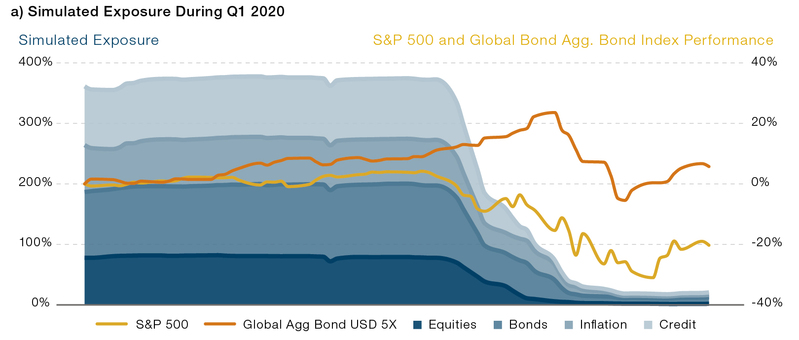
One cannot say that the Covid-19 crisis hit global markets ‘out of the blue'. During late December 2019, the infection had already started to spread out of control in China and southeast Asia. Yet global markets discounted its impact and global equity and bond markets continued to rally. It was only in late February that markets woke up to the pandemic. A theoretical volatility-targeting strategy's response in terms of asset class exposure is highlighted in Figure 1a.
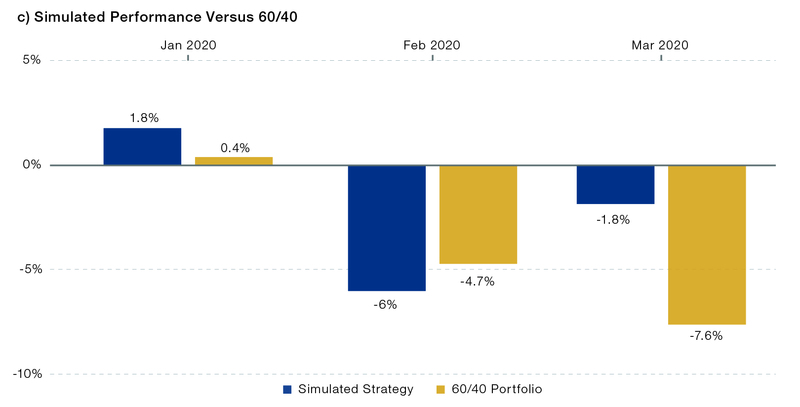
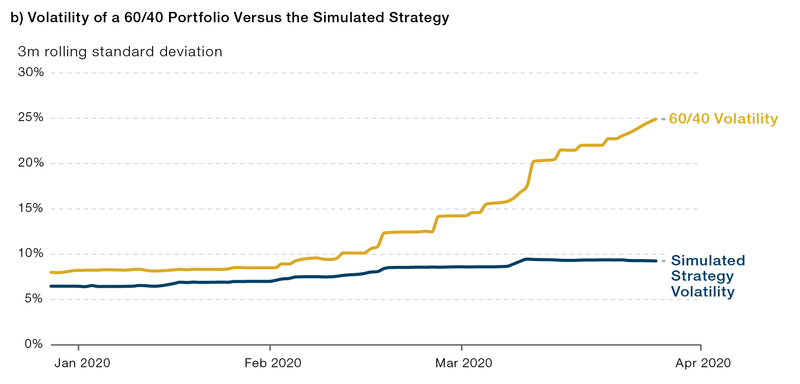
During January and most of February 2020, while markets were calm, the strategy required a gross exposure of 350% in order to achieve its risk-balanced profile and volatility target of 10%. In this benign period, the strategy was fully invested and had almost double the volatility of a 60/40 portfolio (Figure 1b) allowing it to better participate in the market rally and outperform 60/40 in January and early February (Figure 1c).
By the end of February, when the pandemic started infecting global markets, the dynamic risk overlays quickly reacted; volatility first, then momentum, and finally the correlation overlay. This reduced exposure from around 350% to around 30% (Figure 1a). In volatility terms, however, the volatility of a 60/40 portfolio increased significantly from 5% to 30% (Figure 1b). This is because exposures in a 60/40 portfolio are static and portfolio risk therefore reflects higher volatility in markets. The continued falls in risk assets meant that the strategy's outperformance was clearly visible in March 2020, although a rebound in April led to underperformance (Figure 1c).
In summary, although the volatility-targeting strategy entered the Covid-19 market event fully levered at 3.5x, it outperformed an un-levered 60/40 portfolio. This was achieved through the two facets we introduced previously:
- Diversification and a balanced risk-based allocation which mitigated the initial equity losses to mid-February;
- Risk management overlays, which cut risk substantially on rising market volatility.
Figure 1. Covid-19 Case Study

Simluated past performance is not indicative of future results.Illustrative example. For information only.
Source: Man Group, Bloomberg. An example fee load of 0.95% management fee has been applied. A 60/40 composite index is made of 60% MSCI World Net Total Return index and 40% Barclays Capital Global Aggregate bond index (hedged to USD).
The 2008 GFC
In the eyes of many commentators, the Covid-19 crisis had its closest parallel during the GFC in 2008.
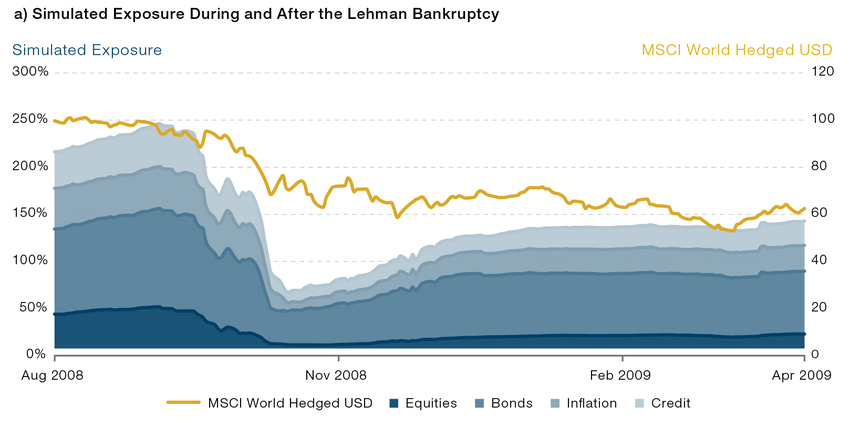
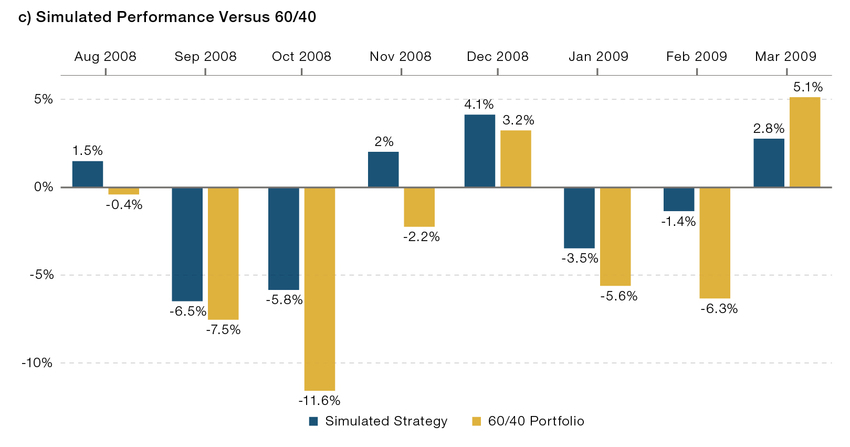
The theoretical volatility-targeting strategy entered the period around 2.5x geared (Figure 2a) but cut exposure quickly to around 0.5. Hence the strategy did not see the same pickup in risk as a static 60/40 portfolio (Figure 2b), and it outperformed as markets continued to fall (Figure 3c).
We see in this example, however, how the strategy re-geared as markets stabilised towards the end of 2008 and into 2009. Total exposure does not reach levels seen before the crisis because volatility remained high, as can be seen in the case of a static 60/40 portfolio in Figure 2b.
Figure 2. GFC Case Study
Conclusion
We have illustrated that, for two of the largest market events in recent memory, the leverage of a volatility-targeting strategy before a crisis does not translate into significant risk or losses during the crisis itself. In contrast, a traditional 60/40 portfolio with less leverage at the outset of each crisis ended up being more risky during the crises and suffered larger losses.
We believe this demonstrates that leverage is not always a good indicator of portfolio risk, especially in the presence of diversification and active risk management.

This post was funded by Man Group