
Highlights
- Monetary policy is transmitting through the euro area economy faster than in the US.
- Fiscal policy is expected to have a restrictive impact on the euro area economy in 2023, while US fiscal policy in 2023 is expected to have an expansionary impact.
- The euro area is more exposed to weakness in the global trade and manufacturing cycle.
Since the aggressive interest rate-hiking programmes initiated by the US Federal Reserve (Fed) and European Central Bank (ECB) in the spring and summer of 2022, respectively, the two economies have been on different trajectories.
On the one hand, the euro area economy has decelerated sharply since the ECB began raising interest rates in the second half (H2) of 2022 and we think data is likely to show the region has entered recession in the second half of 2023.
In contrast, in the US—where the Fed began hiking interest rates earlier, in April 2022—the economy has tracked an annualised growth rate of at least 2% over the same period.
Both central banks applied similar measures to tame inflation - so why is the euro area economy proving less resilient than that of the US? We think there are three factors which explain the different experiences of the euro area and US economy.
Monetary policy more potent in Europe
There is now increasing evidence that there is less of a monetary policy lag in the euro area than in the US. That is, actions by the central bank are likely transmitted more quickly to the real economy in Europe than in the US. As the chart below shows, around 70% of euro area corporate debt is bank-based and therefore more likely to be linked to a variable interest rate than capital market financing.
This contrasts with the US, where almost 75% of corporate debt is financed through the capital markets. US company debt is most likely to be attached to a fixed interest rate via longer-duration investment-grade and high-yield bonds. As such, it will take longer for tighter monetary policy to feed directly into the income statements of corporates across the pond.
Bank financing accounts for the majority of euro area corporate borrowing
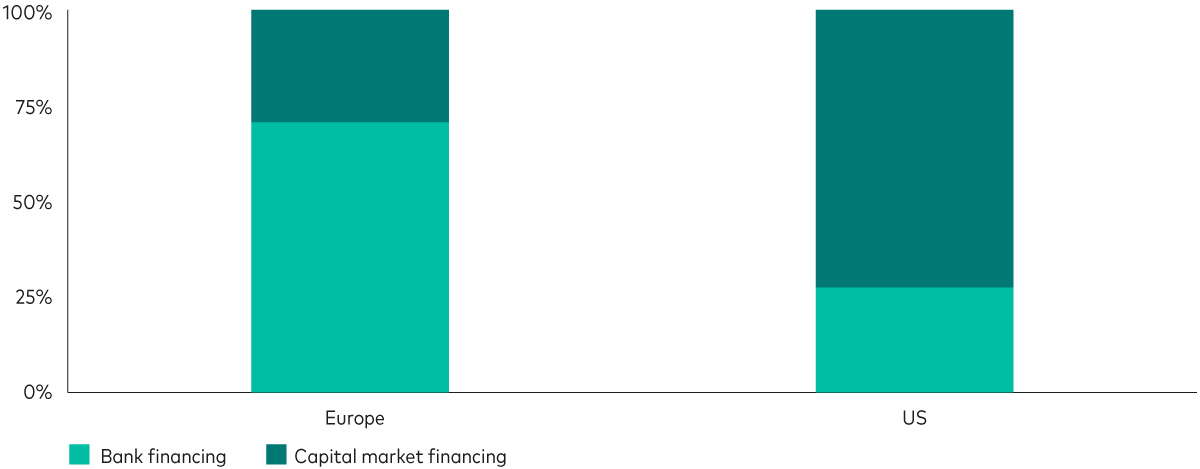
Source: Deutsche Bank, IHS Markit, as at 30 September 2023. Notes: Data refer to the portion of non-financial corporate funding by source.
Our research found that corporate net interest payments are rising sharply in Europe1, while the same can't be said in the US, where net interest is falling. This may be partly because cash-rich companies have been paying down their debt to reduce their net interest burdens during the hiking cycle. Many are also reaping the benefits of longer-duration fixed-rate debt, because the effect of higher interest rates takes longer to feed into firms' profit and loss statements as companies are required to refinance less frequently.
Euro area households are also feeling the pinch of tighter monetary policy. The average effective interest rate on the total stock of mortgage debt has increased almost one percentage point in the last year, according to ECB bank lending data. Italy and Spain have experienced larger shocks than Germany and France as a greater proportion of their mortgage debt is either floating, or fixed at relatively low durations (i.e., two to five years).
Higher interest rates are also having the desired effect on consumption and savings behaviour. The next chart shows how a sharp contraction in broad money (also known as M32) supply growth in recent months has been driven in part by a negative contribution from longer-term financial liabilities (the dark red bars). Essentially, this represents people shifting money out of instant-access deposit accounts into bonds or fixed-term savings products with a maturity of at least two years to lock-in higher savings rates.
With a greater portion of savings tied away for at least two years, purchases of big-ticket items, such as cars or holidays, are likely to be delayed, bringing aggregate consumption down.
Other drivers of the contraction in money growth can be attributed to a decline in lending to private households and businesses (the light blue bars) and quantitative tightening by the ECB (gold bars).
Euro area M3 money supply growth (y-o-y %) decomposition
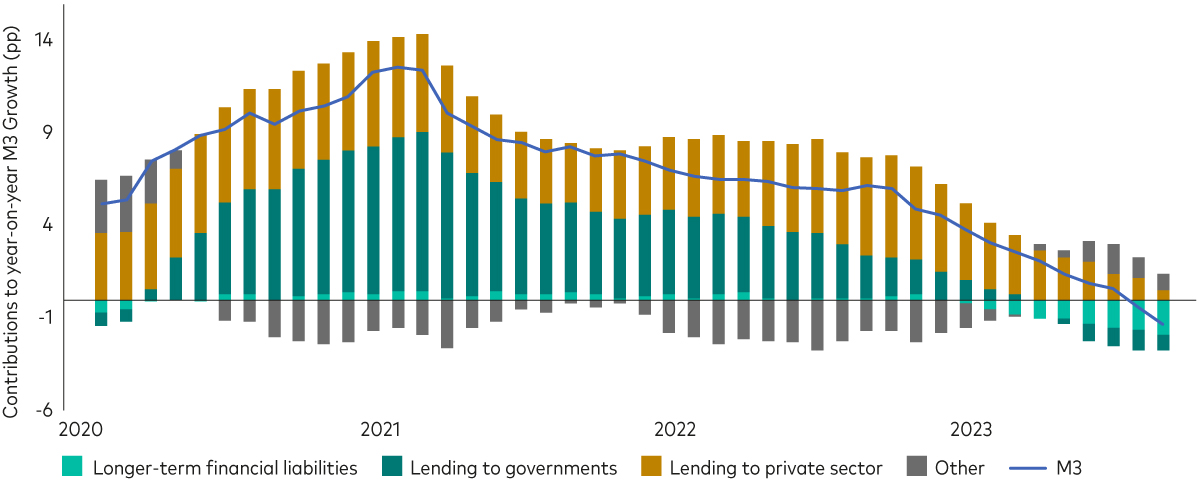
Source: Eurostat, Vanguard calculations, as at 30 September 2023.
Based on our analysis, we think the impact of higher interest rates, which is clearly already starting to have an impact, is still building through the euro area economy and will peak early next year. Our expectation is for a mild recession starting in the second half of 2023 and we wouldn't be surprised if growth continues to be very weak in the early part of 2024 as well.
That said, real incomes (inflation-adjusted wages) are likely to turn positive again at the turn of the year as we expect the falling rate of inflation to dip below the expected average wage growth. Our current 2024 GDP growth forecast for the euro area is between 0.5% and 1%.
Fiscal drag compounding the pain
Fiscal policy is also expected to have a restrictive impact on the euro area economy for the remainder of this year and next. This contrasts with the US, where the fiscal impulse, i.e., the effect of fiscal policy on economic growth, in 2023 is expected to be expansionary3.
Fiscal consolidation in Europe is driven by a fading of 2022 post-pandemic stimulus and support for households in response to rising energy bills. The next chart shows our estimate of the quarterly impact of fiscal policy in the euro area, defined as the annual change in the cyclically adjusted primary balance multiplied by a fiscal multiplier4. The drag from fiscal policy is expected to intensify in H2 2023 and peak at a little more than 0.5% of GDP at the turn of the year.
Euro area fiscal impulse is expected to be negative in 2023 and 2024
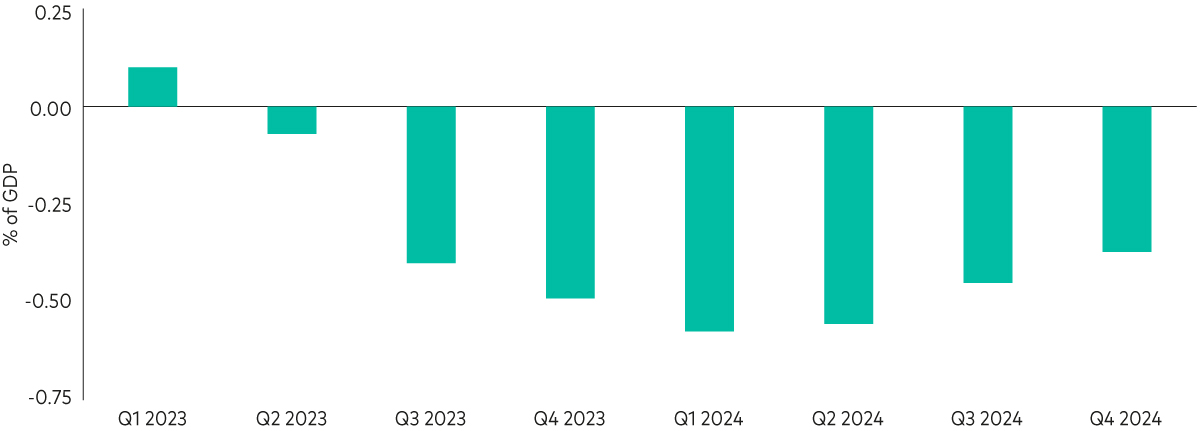
Any projections should be regarded as hypothetical in nature and do not reflect or guarantee future results.
Source: Vanguard. Note: Fiscal impulse calculated as the annual change in the cyclically adjusted primary deficit as a percentage of potential GDP multiplied by a fiscal multiplier. Fiscal multiplier assumptions calibrated using Gechert (2015), where the multiplier depends on the type of spending or taxation and output gap, as well as other factors. Our calculations also include an adjustment for the ‘off-budget' energy support in Germany this year, the €32bn of corporate tax cuts recently announced by Chancellor Scholz, and modest disbursements from the European Recovery Fund in Southern Europe.
Looking under the bonnet, the largest fiscal drag is in Italy, where the tax credit provisions for building renovations (announced in 2020) are phased out from Q2 2023. Italy and Spain have also been hit worst by the unwinding of energy support, equivalent to around 1% of GDP in each for most of 2023. Further, our calculations include an adjustment for the ‘off-budget' energy support in Germany this year, the €32 billion of corporate tax cuts recently announced, and modest disbursements from the European Recovery Fund in Southern Europe.
Further consolidation is expected in 2024 as pandemic- and Ukraine war-related stimulus continue to be unwound, and European fiscal rules become binding again.
Euro area vulnerable to weaker global trade and manufacturing
Finally, part of the euro area's economic weakness can be explained by the soft global backdrop. Total world trade volumes fell 3% in the 12 months to July 20235. As the euro area is a relatively open economy with a large manufacturing base, its activity suffers disproportionately to swings in the global trade cycle.
Indeed, growth in the euro area's five largest trading partners outside of the US is set to slow meaningfully this year. The next chart illustrates this point and shows the consensus expectations of average GDP growth for the five main trading partners—excluding the US—of the euro area (gold bars) and Germany (yellow bars) in 2023 and 2024.
Growth in euro area's main trading partners (ex-US) is expected to slow
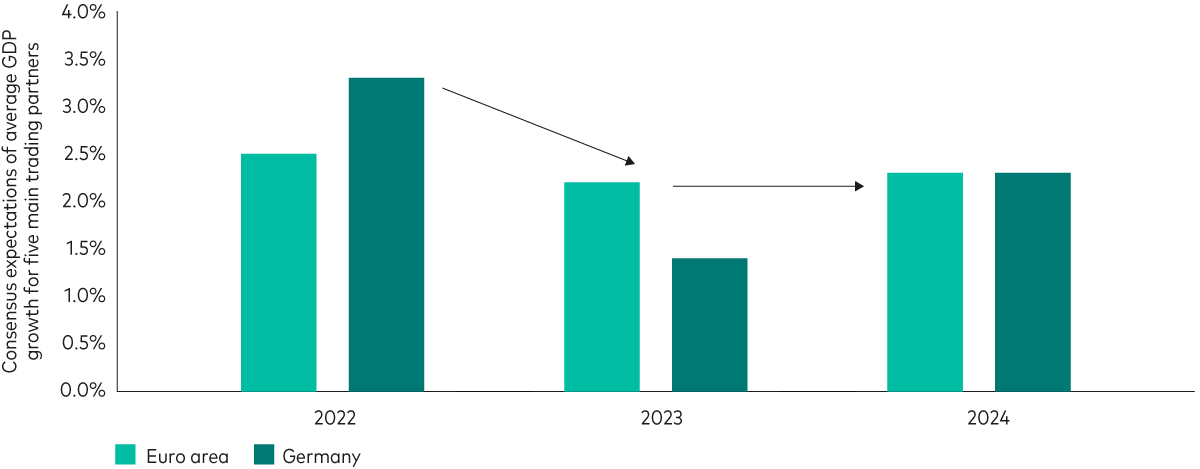
Any projections should be regarded as hypothetical in nature and do not reflect or guarantee future results.
Source: Bloomberg, Eurostat, Our World in Data, Vanguard calculation, as at 30 September 2023. Notes: Euro area's five main trading partners outside of the US are the UK, China, Switzerland, Russia and Turkey. Germany's five main trading partners outside of the US and euro area are China, Poland, the UK, Switzerland and the Czech Republic.
In the three quarters to the end of Q2 2023, euro area exports have contracted by an average quarterly rate of 0.3%. We expect this weak trade momentum to continue until at least the end of the year, with several leading indicators, including the new export orders component of the Purchasing Managers Index survey, consistent with further contraction.
1 Source: Deutsche Bank, ECB, BEA, as at 30 September 2023.
2 Broad money (M3) includes currency, deposits with an agreed maturity of up to two years, deposits redeemable at notice of up to three months and repurchase agreements, money market fund shares/units and debt securities up to two years.
3 See, for example, the IMF's Article IV research note on the United States that suggests fiscal policy will be pro-cyclical in 2023.
4 We use Gechert (2015) to calibrate our fiscal multiplier assumptions, where the multiplier depends on the type of spending or taxation and output gap, as well as other factors.
5 As per data from the CPB Netherlands Bureau for Economic Policy Analysis.
Investment risk information
The value of investments, and the income from them, may fall or rise and investors may get back less than they invested
Any projections should be regarded as hypothetical in nature and do not reflect or guarantee future results.
Important information
For professional investors only (as defined under the MiFID II Directive) investing for their own account (including management companies (fund of funds) and professional clients investing on behalf of their discretionary clients). In Switzerland for professional investors only. Not to be distributed to the public.
The information contained in this document is not to be regarded as an offer to buy or sell or the solicitation of any offer to buy or sell securities in any jurisdiction where such an offer or solicitation is against the law, or to anyone to whom it is unlawful to make such an offer or solicitation, or if the person making the offer or solicitation is not qualified to do so. The information in this document does not constitute legal, tax, or investment advice. You must not, therefore, rely on the content of this document when making any investment decisions.
The information contained in this document is for educational purposes only and is not a recommendation or solicitation to buy or sell investments.
Issued in EEA by Vanguard Group (Ireland) Limited which is regulated in Ireland by the Central Bank of Ireland.Issued in Switzerland by Vanguard Investments Switzerland GmbH.
Issued by Vanguard Asset Management, Limited which is authorised and regulated in the UK by the Financial Conduct Authority.
© 2023 Vanguard Group (Ireland) Limited. All rights reserved.
© 2023 Vanguard Investments Switzerland GmbH. All rights reserved.
© 2023 Vanguard Asset Management, Limited. All rights reserved.